Author: Dr. Zhang Kun Leica Microsystems Life Science Applications Specialist
How to avoid the washout step in live cell markers?
Marking methods such as SNAP-tag have revolutionized live cell microscopy and have been named one of the hottest research techniques in 2004 by Nature. However, the traditional SNAP-tag tag still has a lot of defects. After the substrate BG with the fluorescent probe is added to the cells, the cells need to be washed several times to remove the unbound BG to eliminate the influence of background fluorescence on the imaging. That is, the dynamic change of the SNAP-tag fusion protein cannot be tracked in real time during the binding of the substrate to the SNAP-tag. Scientists such as YasuteruU have developed a fluorescence activation-coupled protein labeling (FAPL) based on SNAP-tag to solve this problem by modifying the substrate of SNAP-tag, so that some intracellular recordings can be performed. Dynamic life processes such as protein expression, localization, transport and degradation [13-15]. Introducing a quenching group at the C-8 position of the Snap-tag substrate BG guanine can effectively absorb by fluorescence resonance energy transfer (FRET) or photoinduced electron transfer (PET). The fluorescent energy of the fluorescent group labeled on BG does not fluoresce prior to binding to the SNAP-tag. Once the substrate binds to the SNAP-tag, the quenching group will dissociate and the fluorophore will fluoresce (Figure 4). Therefore, the fluorescent signal is only ignited on the SNAP-tag fusion protein, so no cleaning steps are required. Utrano and colleagues have successfully applied this labeling method to study the epidermal growth factor receptor (EGFR)-associated membrane trafficking process in cell movement (Fig. 5) [13].
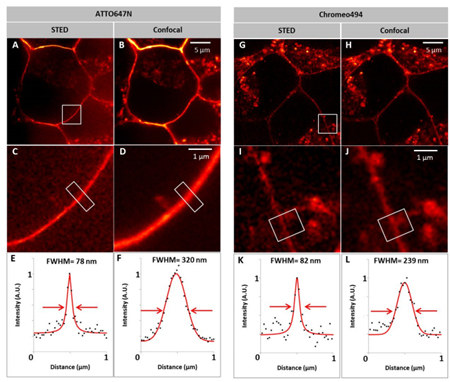
Figure 3. STED ultra-high resolution imaging of EGF and EGFR labeled with ATTO647N and Chromeo494, respectively, in HEK293 live cells. It can be seen from the graphs E, F, K, and L that the imaging resolution of the EGFR-EGR complex by STED is 3 to 4 times higher than that of the confocal.
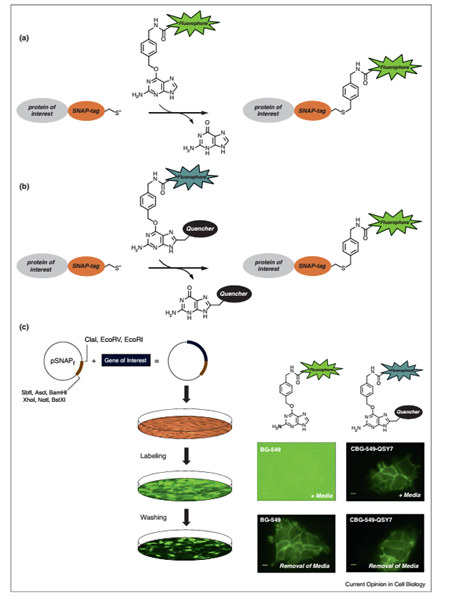
Figure 4. Comparison of traditional SNAP-tag tagging methods and FAPL-based SNAP-tag tagging methods

Figure 5. Real-time recording of EGFR transport in cells. (a) Schematic to explain how to use the FAPL probe to track EGFR-related cell membrane transport processes in real time. (b) EGFR expressed in COS7 cells was labeled with DRBG-488 (green) and lysosomes were labeled with lysosome tracker (red). (c) Confocal real-time imaging of MDCK cells expressing SNAP-EGFR-CFP. SNAP-EGFR-CFP was labeled with DRBG-488. EGF-stimulated cells were added at 5 min and fluorescent images were taken every 1 min. Compared to the imaging of CFP, DRBG-488 was able to more clearly record the formation of vesicles after EGF stimulation and their accumulation in lysosomes.
In order to eliminate autofluorescence and to more clearly fluoresce imaging deeper tissues and even living animals, scientists have never stopped researching near-infrared dyes [16]. Scientists such as Johnsson recently introduced a new cell membrane-permeable near-infrared dye (SiR) based on the sillion-rhodamine fluorophore [17]. Before being bound to a label such as SNAP-tag, the SiR that aggregates or non-specifically binds to the hydrophobic structure will be in a non-fluorescent spirolactone state; once bound to the tagged protein, the SiR will be in a zwitterionic state, and Very strong fluorescence (Figure 6). Marking the SiR of the substrate of the SNAP-tag forms SiR-SNAP. Therefore, when the living cells are labeled with SiR-SNAP, the background fluorescence is very low, thereby eliminating the washing step and real-time fluorescence detection. At the same time, due to the near-infrared nature of its spectrum, it can be applied to deep tissue, such as imaging of brain slices (Figure 7).
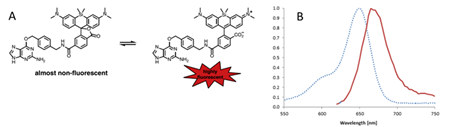
Figure 6. (A) Two forms of SiR. (B) Excitation spectrum (blue dotted line) and emission spectrum (solid red line) of SiR.
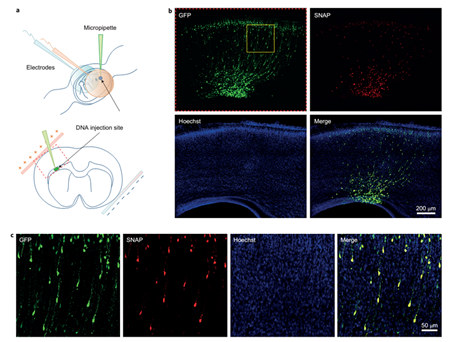
Figure 7. SiR-SNAP labeled rat brain slices. a, a schematic diagram of in situ electrical rotation in the uterus. The area within the red box is the area of ​​the b-picture for fluorescence imaging. b, SNAP and GFP plasmids were introduced into E16 phase neuronal precursor cells in a ratio of 1:1 by intrauterine in situ electroporation. Brain tissue of E19 stage rats was sectioned and stained with SiR-SNAP and Hoechst. c, for the amplification of the yellow box region in panel b, the good co-localization of GFP and SiR-SNAP verified the specificity of the SiR-SNAP marker.
Application of SiR in STED ultra-high resolution microscopic imaging
Johnsson and colleagues also applied SiR-SNAP to live cell imaging of the centromeric protein Cep41 by STED ultra-high resolution microscopy [17] (Fig. 8). Confocal images showed that Cep41-SNAP in SiR-SNAP-labeled U2OS cells was localized in both microtubules and centrosomes (Fig. 8b). The STED ultra-high resolution microscope found that SNAP-Cep41 was arranged in a ring on the centrosome with a diameter of 175 ± 13 nm (n = 7), indicating that Cep41 was localized on the central granule formed by the microtubule (Fig. 8d). Imaging in the Z-axis direction shows that the structure formed by SNAP-Cep41 is approximately 440 ± 28 nm (n = 16), which is consistent with the length of the already reported central granules, indicating that the annular structure formed by Cep41 extends throughout the central granule.

Figure 8. Confocal and STED imaging of Cep41 in U2OS living cells. a, Schematic diagram of the central body structure. b. Two-color confocal image of SiR-SNAP labeled Cep41 and Hoechest 33342 labeled nuclei. c, Confocal and STED fluorescence images of Cep41 bound to microtubules. d, confocal and STED fluorescence images of Cep41 located in the central body. Ruler, 500nm.
Cytosklines such as microtubules and microfilaments have always been the focus of life science research. Recently, scientists such as Johnsson directly labeled SiR in small molecules docetaxel and jasplakinolide, which specifically bind to microtubules and microfilaments respectively, to form SiR-tubulin and SiR-actin, without any transfection or genome modification of cells or tissues. Live cell imaging was performed directly under conditions [18] (Fig. 9). SiR-tubulin and SiR-actin retain the excellent properties of SiR and are ideal for STED imaging (Figure 10). After SiR-tubulin labeled microtubules in human fibroblasts, STED ultra-high resolution microscopy revealed localization and structural information of tubulin in the cytoplasm and on the centrosome. Under this labeling and imaging method, the thickness of microtubules in the cytoplasm is measured to be 39 ± 10 nm, which is the highest resolution of microtubule imaging in living cells. STED imaging also clearly reveals that the microtubules on the centrosome are arranged in a ring of about 176±10 nm in diameter with nine subcomplexes (Fig. 10a, b), and the angle between the two adjacent subcomplexes is 39. ° ± 13 ° (Fig. 10c), these data are consistent with previous data obtained by electron microscopy [19]. After SiR-actin labeled primary neurons in the hippocampus of live rats, STED ultra-high resolution microscopy revealed that the microfilaments were periodically arranged on the axons at intervals of 181 ± 20 nm (Fig. 10d-f). Consistent with previous results obtained with fixed samples [20]. These data fully demonstrate the convenience and reliability of SiR-actin and SiR-tubulin for ultra-high resolution microscopy imaging of living cells. Currently SiR-tubulin and SiR-actin have been commercialized by Spipochrome, and the method of use is also described in great detail.

Figure 9. SiR-tubulin and SiR-actin. a, molecular structure of SiR-tubulin and SiR-actin. b, SiR-tubulin and SiR-actin can only fluoresce after combining microtubules or microwires, respectively. c, SiR-tubulin and SiR-actin labeled human fibroblasts, structured illumination imaging, scale, 5 mm.

Figure 10. STED imaging of live cells labeled with SiR-tubulin and SiR-actin. (a) STED representative image of microtubules on the centrosome of human fibroblasts (already subjected to Richardson-lucy deconvolution). (b) The diameter of the centrioles of humans and mice. (c) The angle between two adjacent microtubule subcomplexes in the centrosome of human and mouse. (d) STED original image of neurons in the hippocampus of the 16-day rat hippocampus after staining with SiR-actin. (ef) Microfilaments are periodically distributed on neuronal axons at a distance of 181 ± 20 nm.
to sum up
The development of new fluorescent probes and imaging technologies has greatly accelerated the pace of life science exploration and will continue to provide extremely important new insights into cell life activities. In the past decade, ultra-high resolution and single-molecule microscopes have developed rapidly and become more mature. It is foreseeable that imaging of living cells with ultra-high resolution microscopes will become a very routine research method in the future. As a step in this direction, the development of various new living cell labeling methods and fluorescent probes has also been favored and valued by more and more scientists. In general, labeling methods such as SNAP-tag have shown great potential in the research and manipulation of living cell systems. The development of new dyes such as SiR will further advance the application of ultra-high resolution microscopy in live cell imaging.
references
13. Komatsu, T., Johnsson, K., Okuno, H., Bito, H., Inoue, T., Nagano, T., and Urano, Y. (2011). Real-time measurements of protein dynamics using -coupled protein labelingmethod. J Am Chem Soc 133, 6745-6751.
14.Sun, X., Zhang, A., Baker, B., Sun, L., Howard, A., Buswell, J., Maurel, D., Masharina, A., Johnsson, K., Noren, CJ , et al. (2011). Development of SNAP-tag fluorogenic probes for wash-freefluorescence imaging. Chembiochem 12,2217-2226.
15. Correa, IR, Jr. (2014). Live-cellreporters for fluorescence imaging. Curr Opin Chem Biol 20, 36-45.
16.Gong, H., Kovar, JL, Baker, B., Zhang, A., Cheung, L., Draney, DR, Correa, IR, Jr., Xu, MQ, and Olive, DM(2012). Near -infrared fluorescence imaging of mammalian cells and xenografttumors with SNAP-tag. PLoS One 7,e34003.
17. Lukinavicius, G., Umezawa, K., Olivier, N., Honigmann, A., Yang, G., Plass, T., Mueller, V., Reymond, L., Correa, IR, Jr., Luo , ZG, et al. (2013). A near-infrared fluorophore for live-cellsuper-resolution microscopy of cellular proteins. Nat Chem 5, 132-139.
18. Lukinavicius, G., Reymond, L., D'Este, E., Masharina, A., Gottfert, F., Ta, H., Guther, A., Fournier, M., Rizzo, S., Waldmann , H., et al. (2014). Fluorogenic probes for live-cell imaging of thecytoskeleton. Nat Methods 11,731-733.
19. Paintrand, M., Moudjou, M., Delacroix, H., and Bornens, M. (1992). Centrosome organization and centriole architecture: their sensitivity to divalent cations. J Struct Biol 108, 107-128.
20. Xu, K., Zhong, G., and Zhuang, X. (2013). Actin, spectrin, and associated proteins form a periodic cytoskeletal structure in axons. Science 339, 452-456.
Review: New Labeling Method for Live Cell Fluorescence Imaging and Its Application in STED [Top]
Intermediate for CAS 175591-09-0
Tapentadol Hydrochloride Intermediate,Tapentadol Hcl,Tapentadol Hcl Api,Tapentadol Intermediates
Shandong Bolode Bio-technology Co., Ltd. , https://www.bldpharma.com