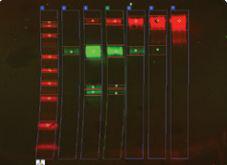
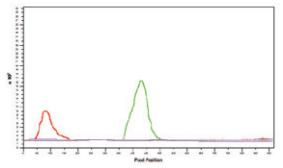
Introduction to AzureSpot Analysis Software
AzureSpot provides tools for analyzing gels and blots, making complex analysis a simple process. AzureSpot software is divided into fully automated or manual analysis to provide flexibility and accuracy for your data analysis.
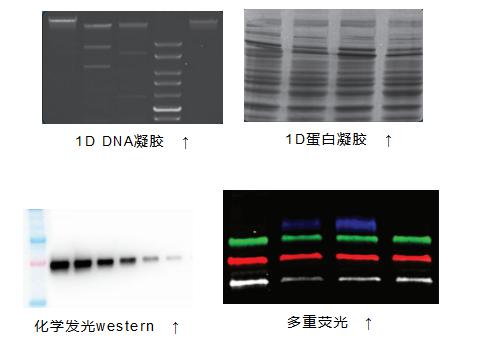
| Tools : | AzureSpot includes: |
| > Automated lane and strip detection | > Automatic PDF report generation |
| > Molecular weight analysis | > Lane creation |
| > Quantitative calibration | > background removal |
| > label | > Strip detection |
| > Multiple analysis | > Molecular Size / pl Calibration |
| > Colony count analysis | > Quantitative Calibration Tool |
| > Microplate analysis | > Modular design for easy selection/deselection |
| > Display data in measurement results column | |
| > Annotate and highlight images |
High-throughput automated analysis process
Start with automatic analysis or start by creating a swim lane. The workflow steps are as follows, and you can fine-tune each step. For 1D gels, highly developed algorithms accurately detect lanes and bands even on distorted gel images.
The user can then perform visual control and data display - output only those important data and selected images.
1. Select the analysis area on the sample

2. Set the threshold and then detect the strip
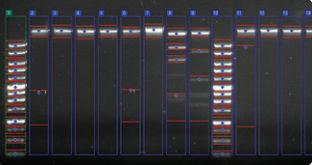
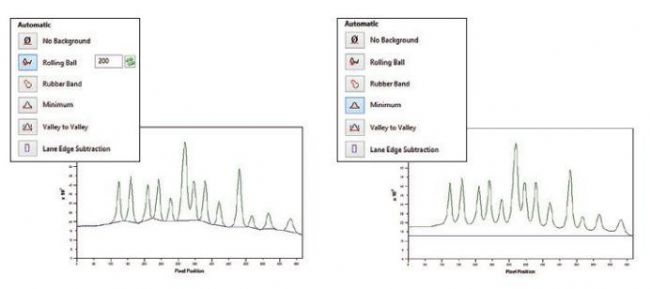
3. Select the appropriate background subtraction method from the background subtraction option
4. View the results, strip boundaries to modify or edit

5. Use the calibrated molecular weight Marker to determine the molecular weight, or use a calibrated standard to determine the relative concentration

Manual rapid analysis process
For gels with only a small number of bands, the results can be quickly obtained by selecting the region of interest around the results.
1. Select the area of ​​interest
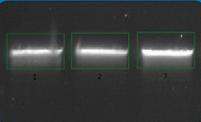
2. Detection background

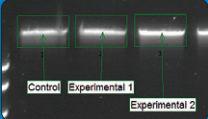
3. Annotation image
Easily perform multiple image analysis
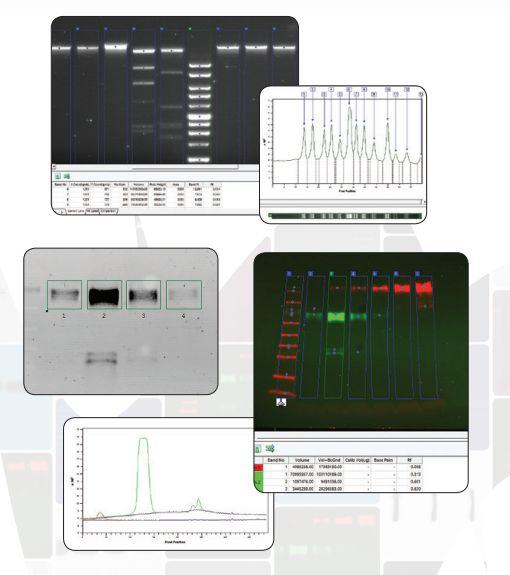
AzureSpot software can view single or multi-channel images and switch views in color or black and white on multi-channel images to ensure optimal analysis.
A. Multi-channel image |
B. Intensity map |
C. Grayscale image in each channel |
A. Multiple images show the boundaries of the lanes and strips; B. The intensity map shows the relative peak intensities; C. View the intensity of each channel from the black and white maps
Result export
In addition to saving images, you can export data in a variety of formats. Export the analysis data directly to Excel, copy the image window to the clipboard, or paste the image configuration file into another program for further analysis.
Simple analysis tool
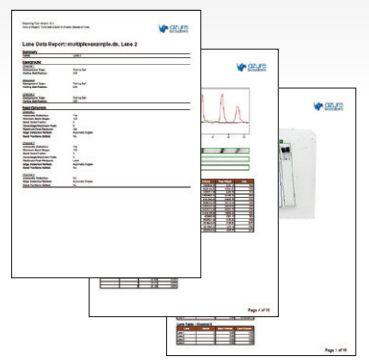
Automated PDF Report Generator: Save your analytics data in a detailed PDF report with a single button.
Central Venous Catheter(CVC)
Objective To study the application of spiral fixation for central venous catheter in clinical nursing.
Cvc Catheter,Medical Cvc Catheter,Single Lumen Central Venous Catheter,Triple Lumen Central Venous Catheter
Zhejiang Haisheng Medical Device Co., Ltd , https://www.hisernmedical.com
